How to check your BandwagonHost bandwidth usage (KiwiVM, API and menu bar)
Three ways to check your BandwagonHost VPS's monthly data transfer: the KiwiVM panel, the 64clouds API with curl, and a Mac menu bar monitor.
Every BandwagonHost VPS plan comes with a monthly data transfer allowance, and it's easy to lose track of until you're close to the limit. Here are three ways to check it, from a quick manual look to fully automatic.
How BandwagonHost counts your data
A few details make the numbers easier to read:
- Inbound and outbound both count. Traffic to your server and traffic from it both use up the allowance.
- Each VPS has its own reset date. It isn't necessarily the 1st of the month. The API reports it as
data_next_reset. - There may be a multiplier. The API returns
monthly_data_multiplier, and both the usage counter and the plan allowance have to be multiplied by it to get the real figures. - "GB" means binary gigabytes. KiwiVM labels sizes as GB but counts 1 GB as 1024³ bytes.
Method 1: the KiwiVM control panel
KiwiVM, BandwagonHost's control panel for your VPS, shows how much data transfer you've used this cycle and when the counter resets. It's the simplest way to check, but you have to remember to look.
Method 2: the API with curl
For scripts, alerts or just a faster check, use the API. In KiwiVM, open API in the left menu. Click Generate if you don't have an API key yet, then note your VEID and API key.
curl -s "https://api.64clouds.com/v1/getServiceInfo?veid=YOUR_VEID&api_key=YOUR_API_KEY"The response is JSON with many fields. These are the ones that matter for bandwidth:
| Field | Meaning |
|---|---|
data_counter | Data used this cycle, in bytes |
plan_monthly_data | Your monthly allowance, in bytes |
monthly_data_multiplier | Multiply both values above by this |
data_next_reset | When the counter resets, as a Unix timestamp |
If you have jq installed, you can turn it into something readable:
curl -s "https://api.64clouds.com/v1/getServiceInfo?veid=YOUR_VEID&api_key=YOUR_API_KEY" | jq '
  (.monthly_data_multiplier // 1) as $m
  | { used_gb: (.data_counter * $m / 1073741824 | floor),
      plan_gb: (.plan_monthly_data * $m / 1073741824 | floor),
      used_percent: (.data_counter / .plan_monthly_data * 100 | floor),
resets: (.data_next_reset | todate) }'Which prints something like:
{
  "used_gb": 74,
  "plan_gb": 1000,
  "used_percent": 7,
  "resets": "2026-10-24T01:59:00Z"
}For history, getRawUsageStats returns per-interval byte counts for roughly the last three months, which is enough to chart daily usage.
Keep your API key private. It gives full control of your VPS, including stopping and reinstalling it. Don't paste it into websites or share scripts that contain it. If it ever leaks, generate a new one on the KiwiVM API page.
Method 3: keep it in your menu bar
If you'd rather not think about it at all, BWH Monitor does the API calls for you and keeps the answer in your Mac's menu bar. A ring changes color as you use data, and you can add alerts at any percentage.
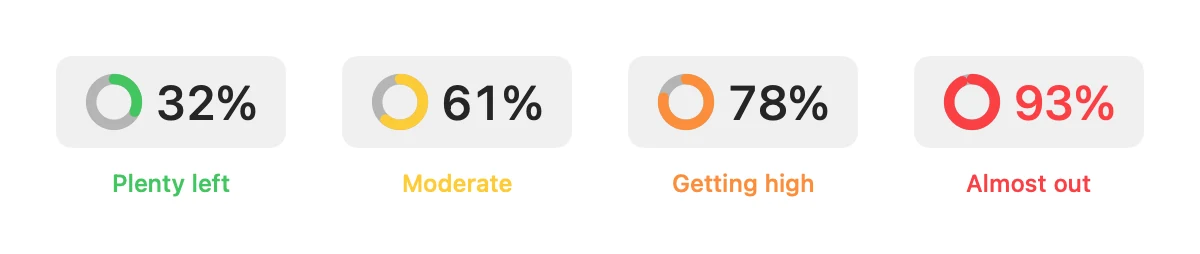
It also forecasts where you'll land by the reset date at your current pace, and works out a daily budget for the rest of the cycle. Your VEID and API key stay on your Mac and are only ever sent to api.64clouds.com.
Tips for making the rest of your allowance last
- Work out a daily budget: data remaining ÷ days until reset.
- Compare your pace with the calendar. If you've used 60% of your allowance but only 40% of the cycle has passed, slow down.
- Set alerts at a few thresholds, for example 50%, 80% and 90%, so you hear about it early.
- Find out what's using it. On the server, tools like
vnstat(traffic per interface over time) andiftop(live traffic per connection) show where the data goes.
BWH Monitor is an independent app and is not affiliated with BandwagonHost or IT7 Networks.